


Council has recorded a net surplus of $6.6 million
The net surplus is calculated using the formula:
Total income – total expenses = net surplus
The main factors contributing to the variance against budget of $5.4 million are detailed in note 36 of the Annual Report.
Council budgeted for a surplus of $12.0 million in the 2012/13 Long Term Plan. The majority of the reported surplus represents funding received from third parties for capital purposes. As this income is received for specific capital projects, it cannot be used to offset rates.
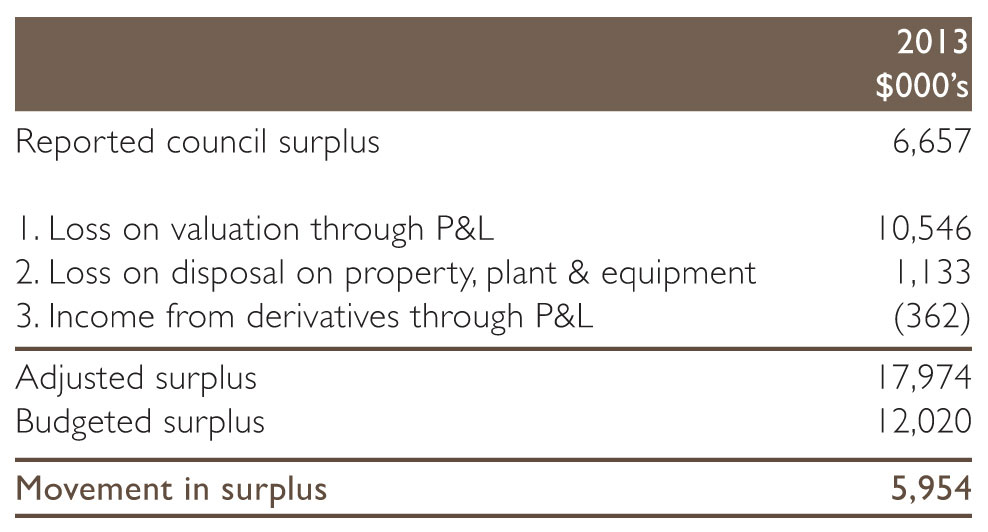
Understanding the Council’s result for the year ended 30 June 2013
The underlying financial performance outlined below shows an adjusted surplus of $18 million versus the budgeted surplus for the year after the exclusion of fair value movements and other items that are not cash expenditure. There were 3 items which have had an impact on the adjusted surplus for the year.
The first item reflects a reduction in valuations of land which saw a significant reduction over and above the revaluation reserves of $10.5m. This was passed through the accounts as an expense in line with accounting standard requirements.
The second item was a loss on disposal of property, plant & equipment of $1.133m. This item is not a cash item and is therefore added back to the recorded surplus.
The third item relates to income from derivative’s that has been passed through the P&L due to some ineffectiveness of swap transactions.
Where our Funds come from
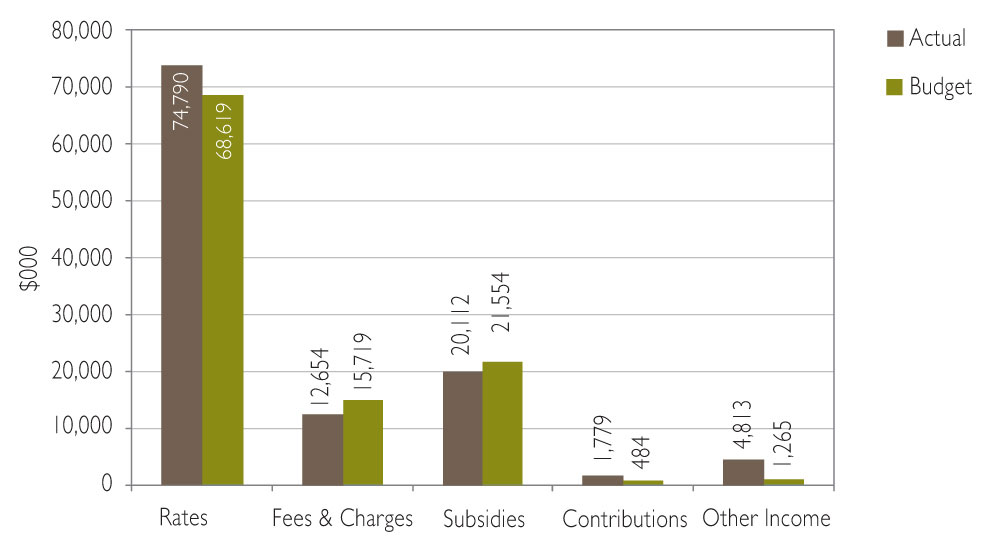
Council receives income from a range of sources. These can be broken down into 5 main categories as shown in the graph above.
Rates
Rates income is the cumulative total that is charged to the ratepayers of the district. It encompasses the general rate, uniform annual general charges as well as targeted rates.
Fees & charges
Fees & charges cover a range of activities within Council. Building consent fees, resource consent fees, hire charges, bulk water purchases and rents.
Subsidies
These are payments that Council receives largely from NZTA towards both operational and capital costs associated with the district’s roading network. Other subsidies can be received in relation to water and wastewater schemes as well as contributions towards replacement of rural fire equipment. These are much smaller in value and variable in nature.
Contributions
These are mainly development contributions but also include vested assets and other minor contributions. Vested assets are items of infrastructure that are vested in Council by a developer and are unbudgeted in any year.
Other income
Other income relates mainly to recoveries and includes income received in relation to rural fire events. Dividends and petrol tax are also included in this group.
Building our Assets (Capital Expenditure)
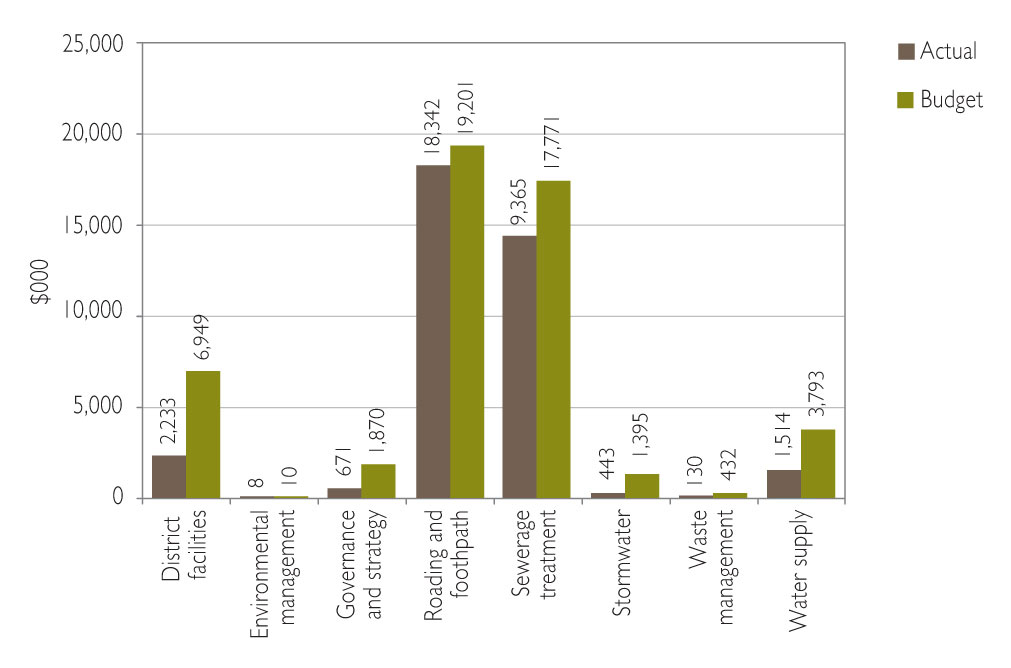
We spent $18,716k less on capital projects than was budgeted. Our total expenditure for the year ended 30 June was $32,707k compared to a budget of $51,422k.
Groups under spent in capital expenditure were:
- District Facilities capital expenditure was under budget by $4,716k. Projects were delayed in relation to halls, parks & reserves and community centres.
- Governance & strategy were under budget by $1,199k. Projects in IT were reassessed and some transferred to outer years.
- Roading and footpaths were under budget by $859k. This was mainly due to a reduction in the programme of work approved by NZTA.
- Wastewater capital expenditure was under budget by $8,406k. This is mainly due to the delays in commencing major projects. Funds had been included for the BOIWW project and that has been delayed until 2014/15.
- Stormwater capital expenditure was under budget by $952k. Projects were delayed during the year.
- Water supply capital expenditure was under budget by $2,280k. Projects were delayed during the year
More information is provided in the appropriate Statement of Service Performance on pages 104 - 224 of this report.