Refuse and Recycling
Sustaining our Environment
At a Glance
Primary Services
- Waste management including refuse
- Transfer stations and recycling
Why We Do It
- Council's vision is for the Far North to waste nothing of value or use, and the amount of waste generated in the Far North is kept to a minimum, so that the maximum value is realised from our renewable resources.
- The refuse and recycling services contribute to the vision by providing the facilities and opportunities to enable the communities in the district to dispose of their waste in a way that minimises the harmful environmental effects, and maximises the opportunities for recycling.
- Council is involved in refuse and recycling because effective management is necessary to protect public health and the environment.
What Has Changed Since The LTCCP 2009/19?
There are no significant changes to the refuse and recycling priorities since the publication of
the 2009/19 LTCCP.
Highlights of Performance

TPM = Total number of Performance Measures

Performance 2010/11 vs. 2011/12 - is neutral
Statement of Service Performance
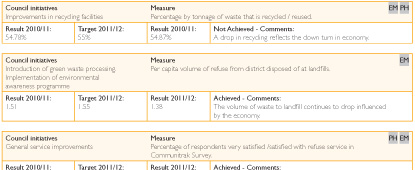
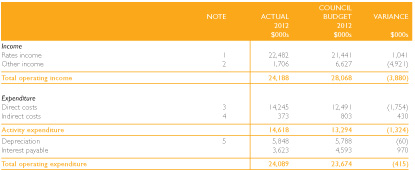
For REFUSE and RECYCLING the following pages detail:
- Service performance information provides levels of service comparative results for 2010/11 and 2011/12 including achievements and issues.
- Financial performance including comparisons against budget 2011/12.
FYI: Key symbols are used to identify each measure contributing to Community Outcomes. For more information on Community Outcomes see the Community Outcomes Diagram.

 Performance 2010/11 vs. 2011/12 - is neutral
 Print the above sections

