 Print the above sections
At a Glance
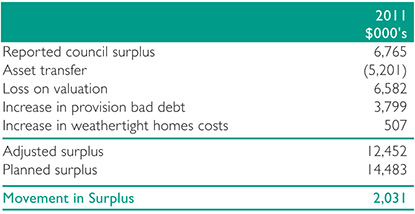
Council has recorded a net surplus of $6.7 million
The net surplus is calculated using the formula:- total income - total expenses = net surplus
Council budgeted for a surplus of $14.5 million in the 2010/11 Annual Plan. The majority of the reported surplus represents funding received from third parties for capital purposes. As this income is received for specific capital projects, it cannot be used to offset rates.
Understanding the Council's result for the year ended 30 June 2011
The underlying financial performance outlined below shows an underlying surplus of $12.5 million versus the budgeted surplus for the year after the exclusion of fair value movements and other items that are not cash expenditure. There were four items which have had a significant impact on the underlying surplus for the year.The first item was an additional non cash dividend payment made by Far North Holdings Limited (Council's Council Controlled Trading Organisation) in the form of a transfer of assets valued at $5.2 million. Whilst this is recorded within the accounts as income, no actual cash was received.
The second item was in line with the reduction in rateable values identified within the Quotable Valuations (QV) for the Far North. Land Valuations saw a significant reduction in 2010/11 and this was passed through the accounts as an expense in line with accounting standard requirements. The impact on the accounts was an additional cost of $6.6 million.
The third item was that Council has increased its provision for bad and doubtful debts by $3.8 million during the year.
Lastly, additional provisioning for non-weathertight homes has also been required totaling $0.5 million. Council does not have a significant exposure to non-weathertight homes claims but is making suitable provisions to offset potential future costs.
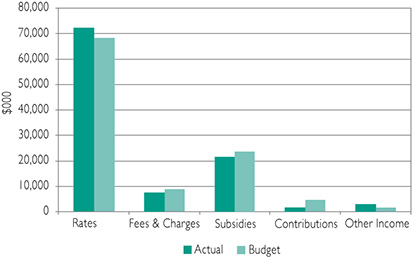
Where our Funds come from
Building our Assets (Capital Expenditure)
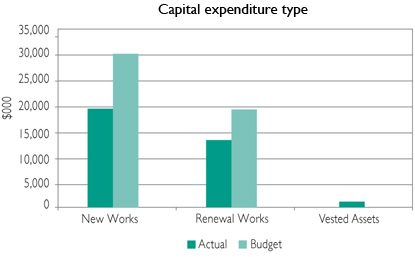
We spent $16,731k less on capital projects than was budgeted. Our total expenditure for the year ended 30 June was $33,414k compared to a budget of $50,145k.
Predominantly this was due to projects being delayed or transferred to a future year.
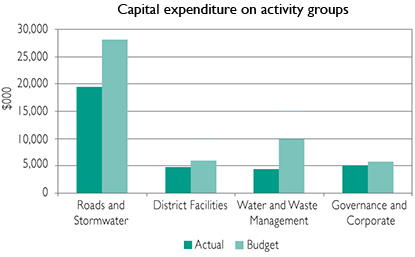
Groups under spent in capital expenditure were:
- Roading capital expenditure down by $8,725k. This was mainly due to a deferral of work.
- District Facilities capital expenditure down by $1,626k. The projects were delayed pending ownership or strategy resolution.
- Water, Wastewater and Refuse capital expenditure down by $5,593k. Following the strategic review carried out in 2009/10, some projects continued to be delayed.
- Governance and Corporate capital expenditure down by $805k, due to a decision to remain with the current fleet of pool vehicles.
- Sustainable Environment capital expenditure up by $7k.